5GCity Monitoring

Authors:
Alessandra Rastelli
Maria Pia Sangalli
A quick overview
The term service monitoring refers to all the activities of collecting, aggregating, analyzing and displaying data relating to a system. The monitoring framework allows you to observe the status of a system and to predict / prevent possible problems before they affect its operation, optimizing user’s experience.
The data to be analyzed are obtained by extracting appropriate metrics from the system, metrics such as the memory, disks, CPU usage… with respect to the system and / or to particular applications instances. This metrics extraction process is called instrumentation.
Each service, along with its own characteristics, is different from any other service and there are many parameters that can be monitored. Metrics can range from low-level resources such as CPU usage to high-level business metrics such as the number of registrations.
The monitoring system for the 5GCity platform monitors the overall virtualized resources (calculation, storage and network) of the three-tier architecture and, through an appropriate set of parameters, the applications and services running on the 5GCity infrastructure.
Regarding the infrastructure, the monitoring system includes three different resource domains, i.e. 1) NFVI resources; 2) SDN-enabled elements; 3) physical devices that do not belong to the first two categories; while with regard to the applications and services, the monitoring system includes VNFs and service monitoring parameters (metrics, useful also to check SLA compliances).
The monitoring system has been integrated with the different orchestration layer components to assist in the network system management. The 5GCity system monitoring is able to provide capabilities to monitor both network and cloud infrastructural elements and the related services with a full end-to-end view. To get this feature, the monitoring system has been thought in a global perspective, with a view to the different services composing the overall infrastructure.
The implemented monitoring system -within 5GCity project – is able to instrument and monitor the different devices composing the overall infrastructure providing a unique and simple-to-access view of the 5GCity platform exposed to both dashboards and analytical techniques collecting and providing all the information needed in a “monitoring as a service” model.
Examples of possible application are:
-
SLA assurance / QoS monitoring
-
Resource utilization (real-time) / Resource optimization
-
Application health / System (or sub-systems) health
-
Data analytics / Root cause analysis
-
Dashboard / data visualization
Monitoring Module
The main components in the monitoring system of the 5GCity platform are the monitoring functionalities related to the overall virtualized resources (compute, storage and network) of the three-tier architecture, as well as a set of parameters related to applications and services running on the 5GCity infrastructure.
The group of infrastructure components includes three different domains of resources:
-
NFV Infrastructure (NFVI) resources that comprise compute, network and storage virtual resources;
-
SDN-enabled elements, including physical and virtual resources, which are usually controlled by a SDN controller;
-
Physical devices that do not belong to the previous categories, such as non-SDN compliant network routers and switches, Small Cells, PNFs and other devices for which we are interested in collecting monitoring information.
The second group of functionalities includes:
-
Virtual Network Functions (VNFs) virtual machines performing specific network functionalities;
-
Service monitoring parameters that represent metrics; they are tracked (meaning data collection) to check the level of compliance of a specific running service with the agreed SLAs.
The monitoring system is integrated with several orchestration layer components, such as the Resource Manager, the Slice Manager, the SLA Manager, and the OSS/BSS systems to provide decision support for multiple purposes such as security threat detection and mitigation, SLA assurance, resource optimization and root cause analysis.

The monitoring framework keeps track of the key performance metrics within the 5GCity, distributed infrastructure, in particular:
-
CPU, Ram and Hard Disk utilisation: especially on the MEC nodes, belonging to cabinets and lampposts, where it is important to monitor the resources allocation and possibly keep it as low as possible;
-
Virtual network devices utilisation, i.e. bitrate on virtual link, packets metrics on data flows, etc.
-
System physical resources, i.e. Radio resources, LTE and Wi-Fi, PNF (Physical Network Functions).
These parameters can be either VM-related information (e.g. CPU utilisation, bandwidth consumption) or VNF specific such as, calls per second, number of subscribers, number of rules, flows per second, VNF downtime, etc. One or more of these parameters, depending on the implemented logics, could also trigger a reaction on the QoS loop.
At Services level, monitoring parameters represent metrics that are tracked to check the level of compliance with the agreed Service Level Agreements (SLA).
Monitoring system implementation
Different tools are available for system monitoring and alerting, including built-in and active scraping, storing, querying, graphing, and alerting based on time series data. Then we decided to use available open source software for monitoring and visual representation in order to focus the most of the efforts to develop a software layer, over the selected tools, able to provide an end-to-end model.
In 5GCity, Prometheus [link_prometheus] has been selected as open source to fulfil the monitoring system requirements, along with Grafana for data analytics and visualization [link_grafana]
Not everything can be instrumented. Applications that do not support Prometheus metrics natively can be instrumented by using exporters. Exporters can collect statistics and existing metrics, and convert them to Prometheus metrics. An exporter, just like an instrumented service, exposes these metrics through an endpoint, and can be scraped by Prometheus.
The monitoring system within the 5Gcity framework is based on:
-
Prometheus – an open source, metrics-based monitoring system and alerting;
-
Grafana – that supports querying Prometheus – is used for the graphic representation of the collected data from the instrumented nodes composing the monitored system;
-
Node Exporter: exposes a wide variety of hardware- and kernel-related metrics in order to allow Prometheus to display and/or collect specific “system” metrics; in the project all the exporters needed by the applications/modules have been and will be ad hoc developed;
-
FrontEnd: it’s a custom java application to manage the inventory of the instrumented objects; the Linux nodes can typically be grouped into services to combine the data related to metrics and/or related to applications.
The Front End application is based on (open) jdk and Wildfly Final.
The main features released at the end of October are summarized in the following:
-
System modelling and inventory (node definition and exporters) via GUI or APIs (web services)
-
Single node management
-
Service (cluster of nodes) management
-
Collection of metrics related to system status
-
Grafana integration
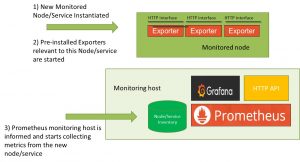
The figure below synthetize the deployment scenario selected in the 5GCity Project

